
How to estimate human equivalent doses from animal studies

I often see people reach incorrect conclusion about doses of supplements and drugs because they read some animal study and then incorrectly calculate how high of a dose a human would need to get the same effect. In most cases, they use erroneous scaling factors to calculate the human equivalent doses. This problem is so prevalent that I have often seen well-known, respected scientists do this and have also seen this mistake in peer-reviewed published studies numerous times.
The need for using scaling factors when translating doses between different animal species
Scaling factors must be used to translate doses used in animal studies to equivalent human doses. If we take, as an example, a 25 g lab mouse and compare it to a 75 kg human adult, the adult weights 3000 times more than the mouse. A simplified dose translation would be to assume a human needs 3000 times higher dose since it weights 3000 times more than the mouse. In reality, the difference is not that large, but it is closer to 400 times. The smaller-than-expected difference is explained mainly by differences in metabolic rate between mice and humans.
An animal that has double the metabolic rate of an adult human will tend to need double the dose of a drug on a body weight basis, which a human needs to get the same effect. For example, if an animal with twice the metabolic rate of a human adult receives 1 g/kg bodyweight of a drug, a human will need only 0.5 g/kg of that drug to get the same effect as the animal. But why is the metabolic rate different for different animals, and what are the correct scaling factors to account for this?
The determinants of metabolic rate – Why it does not scale linearly with body size
The metabolic rate of cells is limited by the rate at which nutrients and oxygen can be delivered to the cells, the rate at which various waste products and CO2 can be removed from the cells, and the rate at which heat can be dissipated from the cells. As mammals grow larger, their volume increases to a greater extent than their body surface area. The body surface area separates the animal from its surroundings and, as such, is the area through which this exchange can occur. A smaller relative body surface area means a smaller relative area to deliver and eliminate nutrients and metabolites. This limits the maximal metabolic rate the animal can maintain and is the fundamental explanation for why larger animals must generally have a lower metabolic rate than smaller ones (1, 2).
Another way to think of this is that, as animals grow larger, the average distance between any two cells of the animal increases. Consequently, the transport network (consisting mainly of blood vessels) must be more extensive for this exchange to occur efficiently. These constraints in delivery are thought to underly the ¾ power law, which is the basis of the main scaling factors that are used to calculate the metabolic rates of animals of different sizes (2).
Common scaling factors
The below table shows scaling factors published by the FDA. These are very commonly used by people when translating doses between animals and humans.

The table above is from Sharma V. et al. 2009 (3).
According to the scaling factors in the table above, to convert a dose in mg/kg body weight to a human equivalent dose in mg/kg body weight, one needs to use a scaling factor of 12.3. This means that a dose of 12.3 mg/kg body weight for a mouse would be equivalent to a dose of 1 mg/kg body weight for a human being. In other words, a human needs 12.3-times lower dose on a body weight basis, to get the same effect as the mouse.
The conversion factors in the table are based on calculating the dose according to body surface area, using the exponent 0.67 in the below equation, whereby Wh is the weight of the human, Wm is the weight of the mouse, and e is the scaling exponent:

The FDA uses a body weight of 60 kg for a human and assumes a mouse weight of about 30 g. Using this with an exponent of 0.67 we get this:

As you can see, this is the scaling factor for mice in their table.
The scaling factors in the table above are widely used because the FDA publishes them, but few people seem to question them or look into how the FDA arrived at these numbers. A closer look at their guidelines shows that the scaling factors in the above table are not representative of the actual metabolic rate difference between humans and these animals (4). This is because the FDA guidelines, as seen in the table, are not guidlines for the most accurate conversion factors and doses but for the estimated maximum safe starting doses to use in human clinical trials (3). For safety purposes, they deliberately add a safety margin that will result in a calculated human equivalent dose that is lower than the true dose so humans will use lower doses just in case. This all reasonable and good, but many people use these factors not knowing that there is already a safety margin included in the above table. These people underestimate the human equivalent dose and often add their own safety margin on top of the factor that already has a safety margin, resulting in a calculated human equivalent dose with a much higher chance of being too low.
The most accurate exponent to translate doses from animals to humans is 0.75 not 0.67. The 0.67 factor the FDA used is the exponent they get after adding the safety margin. If we want the most accurate estimate of the human equivalent dose, using the exponent of 0.75 is better. Before doing this, it should be noted that 30 g is a bit on the heavier side for a lab mouse. They are probably using that because mice used in toxicology studies are often heavier. For example, mice used in studies on longevity are more often around 25 g. Also 70 kg is closer to average weight for a human. If we do the calculation again using these parameters, we instead get:
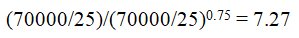
This would be the scaling factor to scale a dose between a 70 kg human and a 25 g lab mouse.
If we do a similar calculation for a lab rat, assuming an average weight of 350 g for the lab rat, we get the following:

This would be the scaling factor to scale a dose between a 70 kg human and a 350 g lab rat. As expeccted, this is a considerably lower value than the one given in the table above.
Using the above scaling factors, a 7.27 mg/kg body weight dose for a mouse would be equivalent to about 1 mg/kg body weight for a 70 kg adult human. Similarly, a dose of 3.76 mg/kg body weight for a rat would be equivalent to about 1 mg/kg body weight for a 70 kg adult human.
Other factors affecting differences in dose equivalence between animals and humans
While body weight differences are the major factor that needs to be considered when converting doses between various animals and humans, especially when the size difference is enormous, as is the case when comparing rodents to humans, it’s not the only factor that influences the differences in effects between species. There are times where the human equivalent dose can differ substantially from the dose calculated using the most correct scaling exponents I presented above. Therefore, it is of course good to be cautious and err on the side of safety when translating doses to humans. (3)
The scaling factors above can be presumed to be most accurate when the drug/supplement/chemical in question has the following qualities:
It is predominantly excreted renally
It undergoes minimal hepatic metabolism or has metabolism that is primarily flow-limited
It has targets that are not subject to large inter-species differences in expression, affinity or distribution, or whose effects are not dependent on a receptor interaction (e.g., antibiotics).
It does not distribute extensively into tissues.
If the drug/supplement/chemical in question has any of the following qualities, the actual human equivalent dose may differ substantially from the calculated dose. In such cases extra caution is advised:
It is highly protein-bound, but this can be corrected for by considering the unbound fraction.
If it undergoes extensive metabolism, and active transport. Important species differences in drug-metabolizing systems must be considered (an example here is that various plant compounds are more heavily metabolized by the livers of humans than rodents and, therefore, have lower bioavailability in humans).
If it undergoes significant biliary excretion (common if molecular weight is over 500 dalton or compound is amphiphilic or conjugated)
If the targets of it are subject to inter-species differences in expression, affinity and distribution.
If it undergoes extensive renal secretion.
If it exhibits significant target-binding effects.
If any of the above applies to the drug/supplement/chemical in question, the scaling factors above can still be used as a starting point, but more research is needed to get a more accurate dose estimate.
Using food intake to estimate scaling factors
The scaling factors can also be roughly estimated by calculating them backwards based on the food intake of humans' relative to mice. This is because the metabolic scaling will be mainly reflected in the differences in calorie intake per kg body weight. The higher the metabolism per kg body weight, the more calories need to be consumed per kg body weight.
To do this, let’s take, for an example, a 70 kg human and assume that human consumes 2500 kcal daily. For comparison, we will assume a lab mouse weights 25 g and eats 4 g of food daily. If the mouse were to get 1 g/kg body weight of some drug as a daily dose, it would get 25 mg of that drug daily. This is equivalent to as if the drug were added to the mouse show at a concentration of 0.625%. To accurately compare the calorie intake, we have to calculate it based on mice and humans eating foods with the same calorie density. For this purpose, we can use mouse lab chow as the example. Lab chow is pretty dry and has a calorie density of about 3.5 kcal per 100g. If we use an average calorie intake of 2500 kcal per day for a 70 kg human, that human would need to eat 714 g of food of the same calorie density daily to get 2500 kcal daily. With a concentration of 0.625% of the drug added to the food, the human dose would be 4.46 g daily or 64 mg per kg body weight. This is 15.6 times more than the mouse on a body weight basis. Therefore, based on this rough estimate, the scaling factor would be 15.6.
This method overestimates the scaling factor, which is not that surprising. This method is not remarkably accurate since while food intake scales very strongly with metabolic rate, the relationship between the two is not entirely linear. One factor here is that lab mice fed ad libidum usually overeat, which leads to overestimation of their metabolic rate based on food intake. Their food intake can also differ significantly depending on the environmental temperature and the palatability of the food. In additions, differences in the efficiency of digestion and absorption of nutrients influences estimates based on food intake. These factors all make this method considerably less accurate. But it can still be used for rough estimates.
Conclusion
The FDA scaling factors are not the most accurate ones. Instead , they are designed to give conservative human equivalent doses for safety purposes. As long as this is kept in mind and communicated, it’s perfectly fine to use the FDA scaling factors.
However, it’s better to use scaling factors based on the 0.75 exponent for more accurate translation of doses from animals to humans. That gives a scaling factor of 7.27 for mice, and 3.76 for rats.
Finally, it goes without saying that anyone intending to consume something based purely on evidence from rodent studies should err on the safe side regarding the doses. That’s a case where using a safety margin is strongly advisable
Online dose translation calculator
An online calculator has been built based on the dose translation methods described in this article. It allows rapid conversion between animal and human doses using the scaling approaches discussed above.
The calculator is available here.
The source code is open-source and can be inspected here.
References
1. Niklas KJ, Kutschera U. Kleiber's Law: How the Fire of Life ignited debate, fueled theory, and neglected plants as model organisms. Plant Signal Behav. 2015;10(7):e1036216. doi: 10.1080/15592324.2015.1036216. PMID: 26156204; PMCID: PMC4622013.
2. West GB, Brown JH. The origin of allometric scaling laws in biology from genomes to ecosystems: towards a quantitative unifying theory of biological structure and organization. J Exp Biol. 2005 May;208(Pt 9):1575-92. doi: 10.1242/jeb.01589. PMID: 15855389.
3. Sharma V, McNeill JH. To scale or not to scale: the principles of dose extrapolation. Br J Pharmacol. 2009 Jul;157(6):907-21. doi: 10.1111/j.1476-5381.2009.00267.x. Epub 2009 Jun 5. PMID: 19508398; PMCID: PMC2737649.
4. Guidance for Industry Estimating the Maximum Safe Starting Dose in Initial Clinical Trials for Therapeutics in Adult Healthy Volunteers https://www.fda.gov/media/72309/download